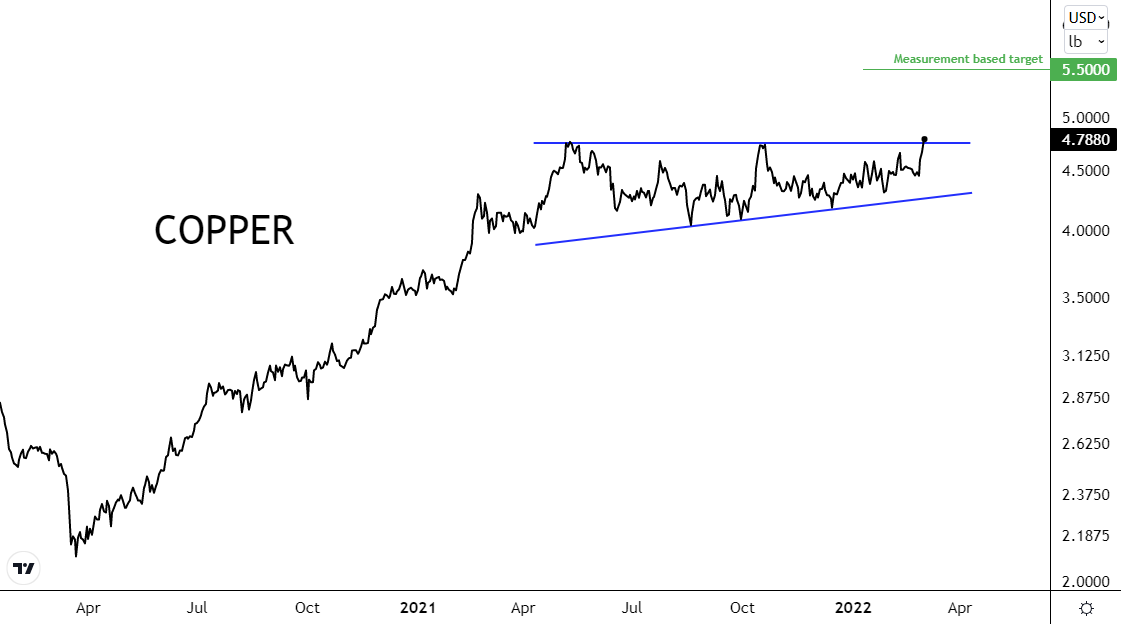
We're keeping this short and sweet, inflation's been running rampant on a global scale and we can't help but feel that central banks are trapped. They undoubtedly feel the pressure. Oil reached 110 dollars per barrel and copper's been flirting with 5 dollars per pound (or 11 dollars per kg). It's copper we're going to be talking about here. Copper's been moving sideways for a couple of months now, since May 2021 to be precise when it peaked around 4.90 dollars. Inflation has been a real issue lately which is a huge catalyst. Copper might be heading to five dollars for the first time in history.
Take a look at the chart displaying the copper future below. A picture perfect consolidation in the form of an ascending triangle. A breakout above the upper boundary could cause the price of copper to skyrocket. The measurement rule objective would give us a price target of around 5.50 dollars for copper, but commodities are known for their huge prolonged trends which means copper could go a lot higher.
I've added an indicator to the weekly copper chart as well which you can see below, it is a 40-week Bollinger Band width indicator that basically shows us if the asset is or isn't experiencing a trend. During low volatility and non-trending periods, the indicator will print lower. On the other hand, if we're in a high volatility period where a new trend has been set the indicator will start rising. The reason is simple, Bollinger Bands will expand during high volatile trending periods and contract during low volatile sideways periods. The indicator plotted here just takes the width of the two bands. Here's what's interesting about that: low volatility begets high volatility and vice versa. The volatility on the weekly chart of copper is at historical lows so if you were paying attention you know that we're about to see a period of high volatility. And surprise, succesful breakouts create volatility in terms of new trends.
INFLATION IS OUR BAROMETER
Now, a sustained trend period in copper is of course very much dependent on whether we'll continue to see inflation rise. I also talked about oil before, right? Well, with a good reason. To my huge surprise, almost every time I talk about markets with non-traders, they're shocked to learn the correlation between oil, copper, steel, aluminum, etc...These commodities move simultaneously, especially during inflationary periods. That is why the inflation rate is our number one barometer when it comes to gauging all of these commodities. Take a look at the chart below that shows us the correlation between oil, copper, and the US inflation rate. Steel and aluminum are not visible on the chart but move in the exact same way.
Now, you should realize that there's definitely some risk involved here (like any trade for that matter). The fed could easily throw our long copper trade out the window. A few well-thought-out words and some tweaks to their policies and the whole market could shift dramatically. It's of course not as black and white as I make it seem but it's something you should still take into consideration if you do decide on hopping on the long copper trade. Here's another look at the inflation rate of the US and Eurozone
What's your opinion on copper? Do you think it'll reach new all-time highs? Or are we about to see copper enter a downtrend instead? I'd love to hear your opinion! Don't hesitate to comment on the post or reach out via the contact form.


Is gold going higher?
ReplyDeleteDefinitely possible, but I don't think inflation is the catalyst right now.
Delete