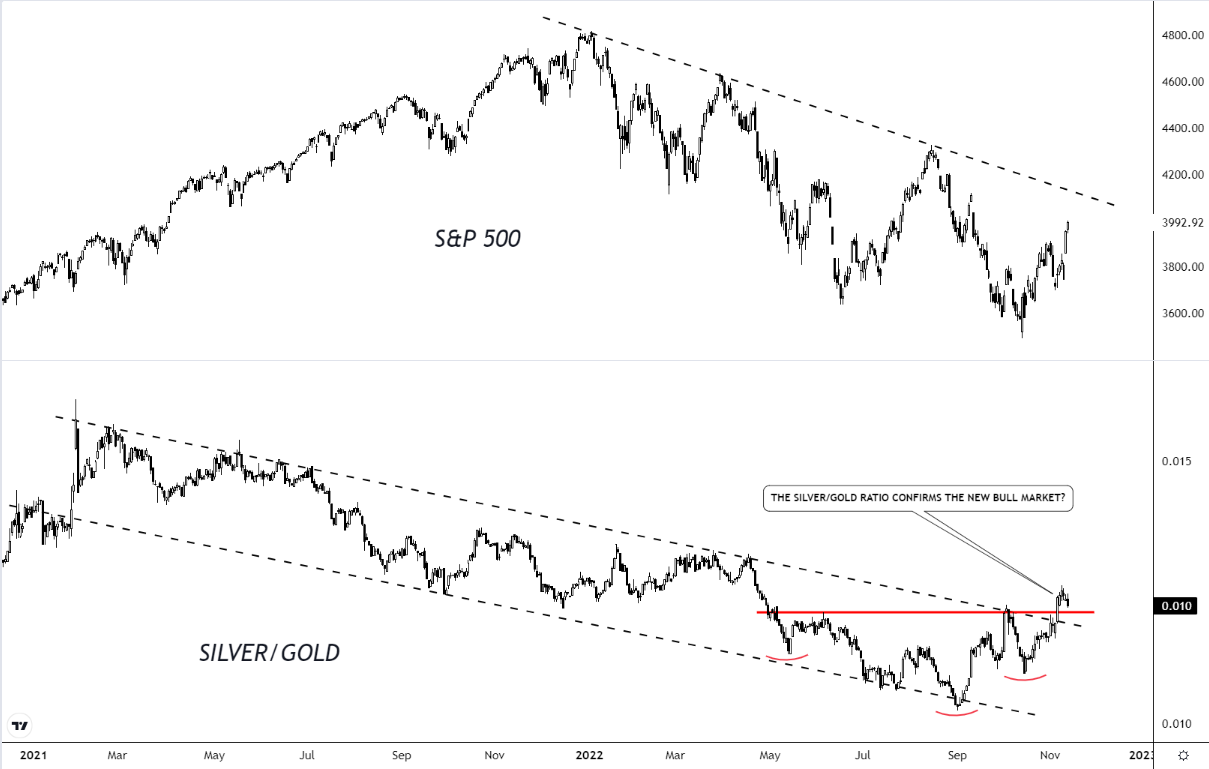
It's been an explosive week, CPI came in much lower then expected and indices across the board put in record moves. The Nasdaq Composite rose almost 10 percent in only two days. The Russell and the S&P closed 7 percent higher since the CPI release too. All in all, a significant week. In this post though I wanted to talk about a ratio that has my current attention which is the Silver/Gold ratio. This ratio has just recently seen a breakout of the almost two year long descending channel which is actually very valuable information given the state of the market.
The silver/gold ratio is one of those ratios that isn't talked about a lot yet it usually gives us a heads-up in the beginning of true bull market rallies. The ratio will frequently call the bottom in risk aversion. If the silver/gold ratio moves higher, it can signal that investors are willing to take up a little more risk. The idea behind it is rather simple. Silver is a bit more of a risk asset and once that metal starts outperforming gold we know that investors and traders are feeling their appetite for risk increasing.
The main use of this ratio is primarily to determine whether a market bottom is really a bottom or if it's just another bear market rally. In any other environments, like an intermediate pullback the ratio is very unreliable but in moments like these, where we're looking for market bottoms after a relatively large decline, it can be a very important signal to consult.
Another thing to take into account is that the use of this indicator is usually reserved for investors that have longer holding timeframes. The signals flashed by the silver/gold ratio frequently "lags" the market bottom by a couple of days/weeks. Below I've added an example of that in the market bottom of 1982 - 1983. The S&P 500 starts moving significantly higher before the ratio confirms the rally. Though, this is not an issue as timing a bottom precisely is almost impossible anyway. Calling a new bull market does require quite a bit of new data to confidently be able to make a call like that. So, even if the ratio technically "lags" the beginning market move, the confirmation of a new bull market is timed adequately as bear market rallies have almost the same characteristics as the beginning stages of a market bottom.
And lastly this is how the silver/gold ratio currently looks like compared to the S&P 500. Now, one thing to note here is that the ratio needs to stay above the channel and the pattern boundary of the Head & Shoulders. We're not trading the ratio and it's just being used as an indicator but respecting those levels is of vital importance to the idea that we might see a significant bottom in the broad equity markets.
What do you think? Are we going to see a significant bottom in stocks? Make sure to leave a comment below!


